ASHY PLC SALES REPORT

 Introduction

Ashy PLC is a large retail company with a many outlets across the United States. The company sells variety of products ranging from electronics, offices supplies to home appliances. 
The company want to expand its operation across the globe and management want to have a comparative analysis of its sales performance from 2014 to 2017.

Purpose of Project

This project is aimed at comparing revenue performance of Ashy for the period 2014 to 2017 and advice management on best ways to maximize profit. 
The project will discuss as much insights as possible to improve performance.

Asking the Right Questions

I started this project by asking some vital questions which are fundamental to the success of this project. I need to understand who the stakeholders are, the source of data and the business problem. I asked the following questions;
  • Who are the stakeholders
  • What is the business problem the company want to solve
  • What are the sources of data
  • Which people will make use of the final findings
The vice president Anold Wagner and head of  marketing Jossy Brown are the two stakeholders for the project.

Preparing and Processing Data

Data for this project will all come from internal sources. The company has 4 datasets consisting of all regions and their sales figures over the years.
These datasets were stored in csv files named; customers, orders, geography and products
  • I started by importing all four csv files into excel and inspecting them.
  • Data was then imported into power query editor for cleaning. 
  • Row number columns deleted for each data set.
  • Data types were changed to the appropriate type.
  • Null values were deleted for all tables.

Data Modeling

With 4 datasets, I need to create a relationship between them to get accurate analysis. Datasets were transformed into power bi for modelling. 
  • The orders table was made the facts table with orderid being the primary key.
  • Customers data made dimension table with customerid being the primary key.
  • Geography a dimension table with postalcode the primary key.
  • Products also a dimension table with productid the primary key.
  • Relationship created by mapping customers, geography and products tables unto orders table.

Data Analysis Expression (DAX)

In order to create a comparative report, new dimensions need to be created using DAX.
These DAX were used;
  • CALENDARAUTO() Calendar table was created containing all transaction months from start to end date of the datasets.
  • YEAR() Year column extrated from calendar date
  • MONTH() month and quarter columns extracted from calendar date.
  • CALCULATE()
  • FORMAT()
  • SPLM()
  • SPLY() 

Visuals

Visualizations were designed and created with power bi.

Revenue by Year and Category


Revenue by Segment


Sales Forecast for 2018


Month on Month Percentage Variance


Revenue v Revenue Same Period Last Year


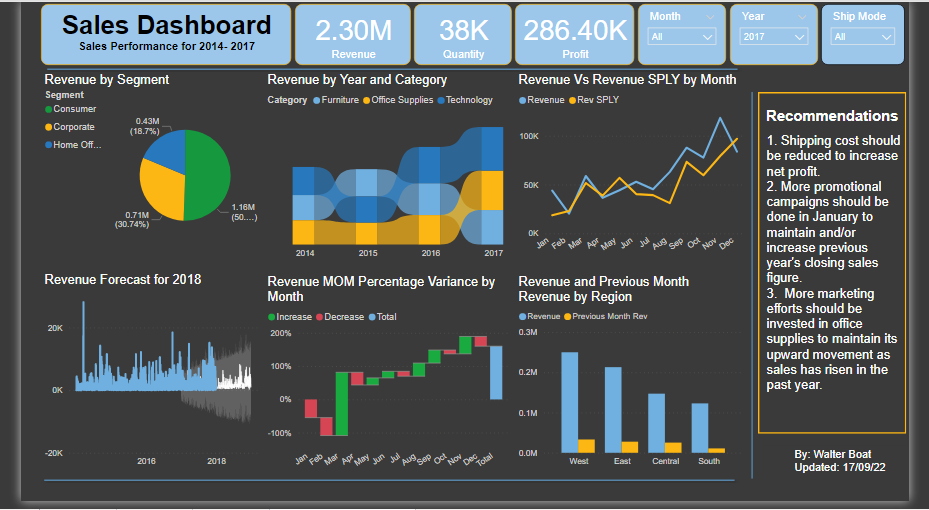
Sales Dash Board


Insights

  • A total of 38,000 items were sold
  • Total Revenue for the period was $2,300,000
  • Total Profit amounted to $286,400
  • Consumer segment accounted for over 50% of total sales
  • Technology category consistently enjoyed highest sales value

   RECOMMENDATIONS

  • Sales should be monitored in January to ascertain the causes of consistent decrease from December.
  • Shipping costs should be reduced to increase net profit.
  • Marketing efforts should be focused on office supplies to maintain its upward trajectory. 

Comments

Popular posts from this blog

WHAT IS DATA ECOSYSTEM

An ecosystem, to put it simply, is a collection of components that communicate with one another. The jungle in a tropical rainforest or the amazon rain forest are examples of vast ecosystems. The germs on your skin may also be small, like tadpoles in a puddle. Additionally, data has its own ecology, just like the kangaroos and koala bears that reside in the Australian desert. Data is produced, managed, stored, organized, analyzed, and shared through the interaction of many different parts that make up data ecosystems. These components include the people who use the tools, as well as the technology and software. The cloud is another place where data can be found. Instead of storing data on a computer hard disk, you can use the cloud. So, data is accessed through the internet rather than being stored somewhere inside your company's network. As a data analyst, it is your responsibility to make the most of the cloud's role in the data ecosystem, locate the pertinent data, and offer...

BIKE SALES ANALYSIS WITH MS EXCEL

Introduction This project was an analysis of a Bike Selling Company`s dataset of its potential customers. This project was undertaken as a challenge by my mentor,  Alex the Analyst. The purpose of this project was to, among others; Find the correlation between income of citizens and their ownership of bikes. The relationship between marital status and owning a bike. If the distance people commute to work affect their bike purchase. How the education level of people influence their willingness to buy bikes. The relationship between different age groups and their purchase of bikes. Any other insight that may arise from the analysis. Data Gathering and Transformation The dataset was downloaded from Github. The link to the dataset was provided by Alex the Analyst , a mentor in the data community. To get the data, I simply clicked the link provided under his Youtube video and was taken to his Github Repository. The dataset was downloaded and converted to excel sheet. Cleaning the Data T...

The Benefits of Supply Chain Analytics for Company Revenue

Businesses have several difficulties with supply chain management (SCM), including a need for more transparency, production scheduling, and team synchronization. Intelligent data analytics are used by businesses in the manufacturing, retail, and fast-moving consumer goods (FMCG) industries to address these issues. Supply chain analytics is the phrase for this. Companies can use it to determine consumer preferences and forecast future product or service demand. Let's examine supply chain analytics in more detail. Supply Chain Analytics: What Is It? It alludes to the improvement of supply chain procedures through the application of big data analytics. Simply put, it refers to using various tools to analyze the data gathered during the SCM process and extract real-time insights to enhance logistics and the SCM environment. Three main elements make up supply chain analytics: a software platform, data analytics, and data visualization. Data analytics makes it easier to get insightful ma...