 Introduction
This project was an analysis of a Bike Selling Company`s dataset of its potential customers. This project was undertaken as a challenge by my mentor, Alex the Analyst. The purpose of this project was to, among others;
- Find the correlation between income of citizens and their ownership of bikes.
- The relationship between marital status and owning a bike.
- If the distance people commute to work affect their bike purchase.
- How the education level of people influence their willingness to buy bikes.
- The relationship between different age groups and their purchase of bikes.
- Any other insight that may arise from the analysis.
Data Gathering and Transformation
The dataset was downloaded from Github. The link to the dataset was provided by Alex the Analyst, a mentor in the data community. To get the data, I simply clicked the link provided under his Youtube video and was taken to his Github Repository. The dataset was downloaded and converted to excel sheet.
Cleaning the Data
- The dataset cleaning was done with MS Excel. First, the duplicates values was removed. I deleted 26 duplicated values in total leaving only unique values.
- Next, the Marital Status and Gender column values were replaced as follows; M=Married, S=Single, F=Female, M=Male. This was done by pressing CTRL +H which opens the Replace Menu that allows all values to be replaced at a go.
- Then the data type of the Income column was changed from general to currency.
- A new column (Age Bracket) was created to group the ages in ranges, Adolescent, Middle Age and Old. This was down using Nested IF function.


Data Analysis
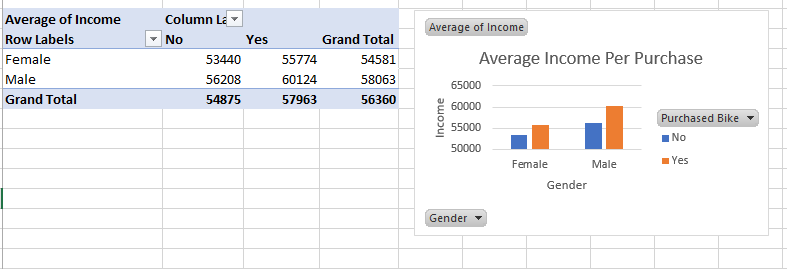
The data analysis was done using pivot tables and pivot charts. Three pivot tables were created ( Purchase per Gender by Income, Customer Commute, Bike Purchase per Customer Age bracket). These charts will later be used for the dashboard.
Report Design
A simple dashboard report was created using the pivot charts.

Insights
- People with higher income purchase more bikes than those whose incomes are lower.
- Married people purchase 7% more bikes than singles people.
- People who commute within 1 mile own more bikes.
- People who have Bachelors Degree purchase more bikes than people with lower education.
- Middle age people between 31 to 54 own significantly more bikes than other age groups.
Comments
Post a Comment